


Learn how to build a virtual dataset in BI Builder. You can combine data from deals, products, and custom fields, then use it in a chart.
Open BI Builder and go to SQL > SQL Lab.
Create dashboards in BI Builder

Set up parameters
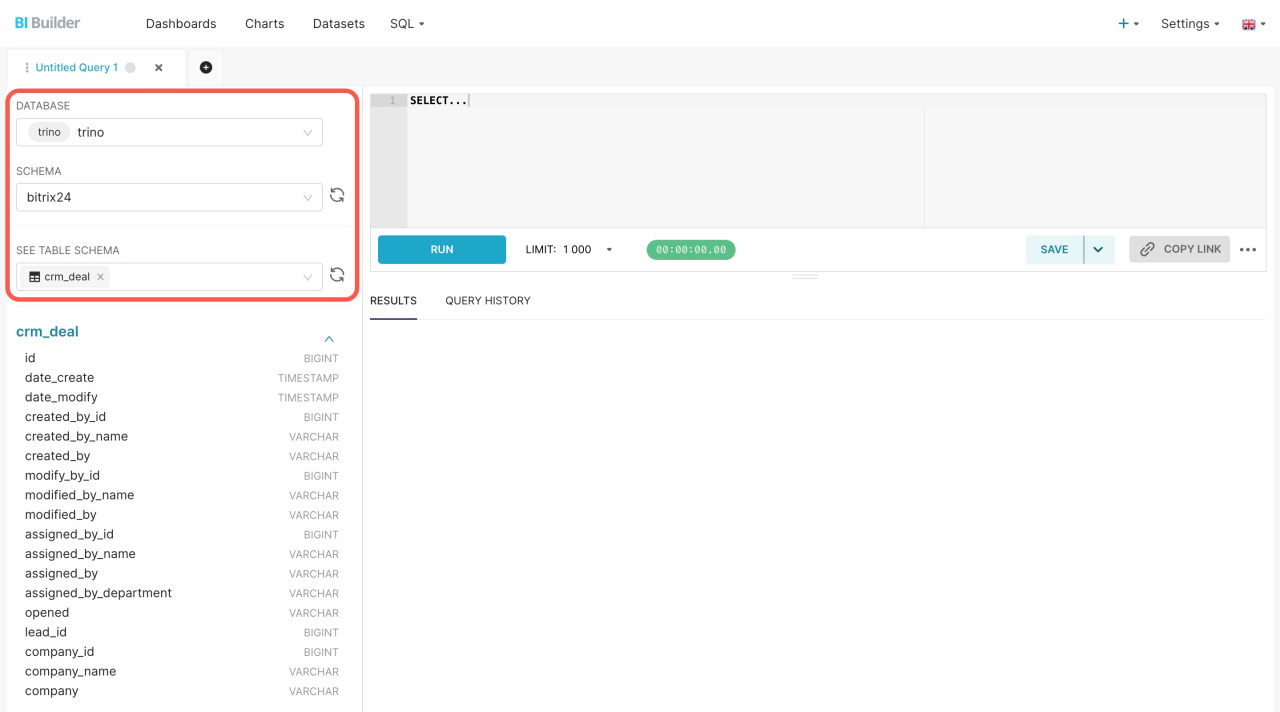
Configure the following:
- Database: trino
- Schema: bitrix24
- Table: crm_deal
Write the SQL query
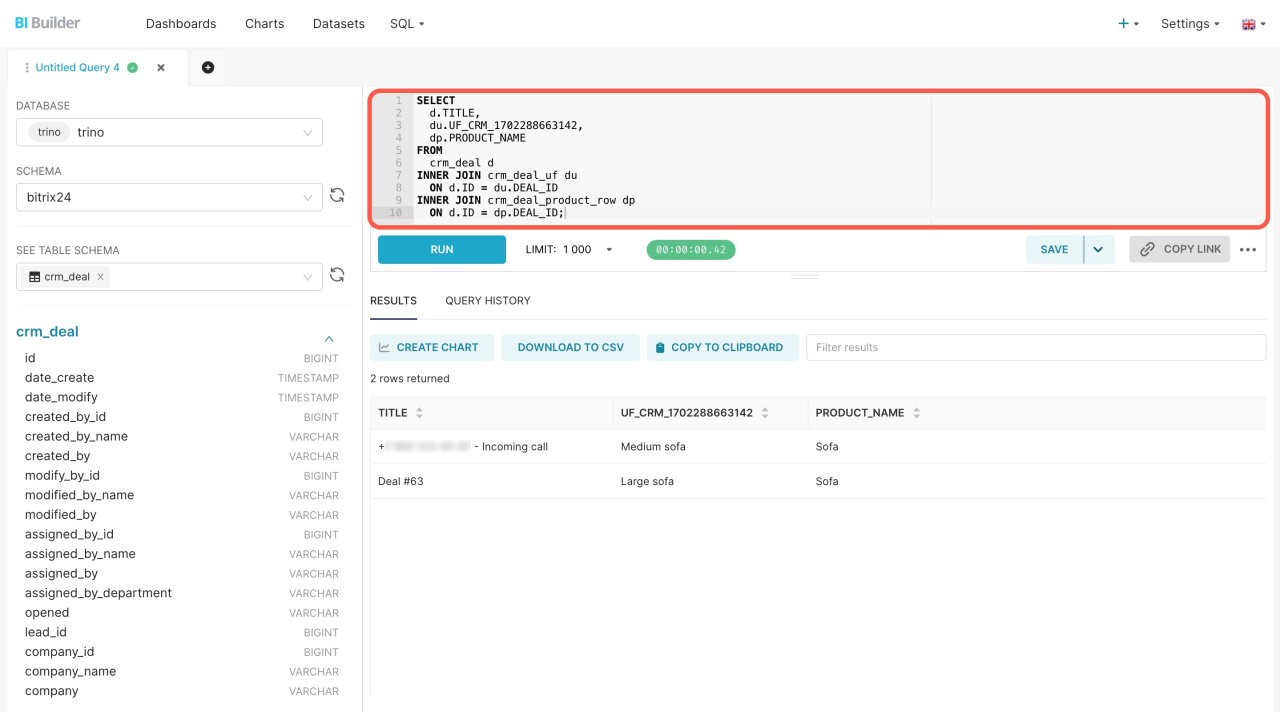
Add your query in the editor. This query does four things:
-
d.TITLE returns the deal name from
crm_deal. -
du.UF_CRM_1702288663142 returns a custom field from
crm_deal_uf. Replace this with your field ID from CRM. To find it, open a deal, right-click the field, and click Inspect. -
dp.PRODUCT_NAME returns the product name from
crm_deal_product_row. -
INNER JOIN links the tables using the shared
DEAL_ID.
SELECT d.TITLE, du.UF_CRM_1702288663142, dp.PRODUCT_NAME FROM crm_deal d INNER JOIN crm_deal_uf du ON d.ID = du.DEAL_ID INNER JOIN crm_deal_product_row dp ON d.ID = dp.DEAL_ID;
Save the dataset
- Click Save as new.
- Enter a clear name for the dataset.

Rename columns
Make the dataset easier to read:
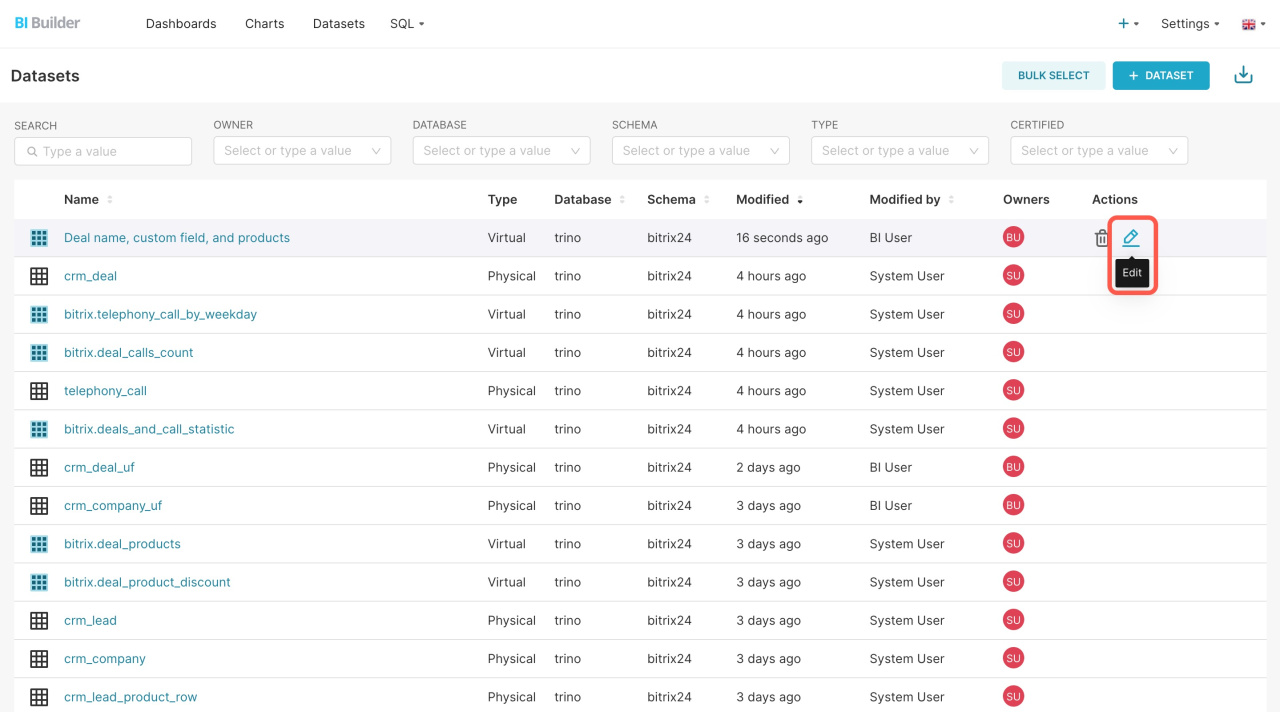
- Go to Datasets.
- Click Edit next to your dataset.
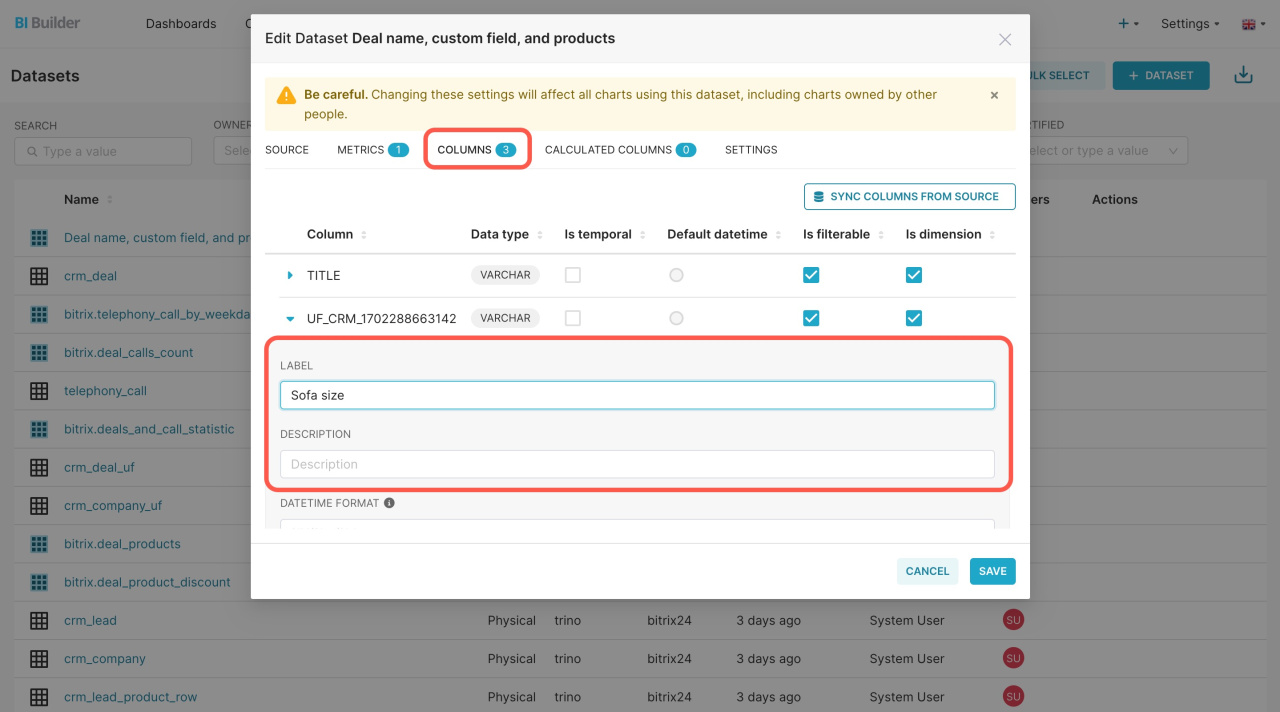
- Open the Columns tab.
- Update column names in the Label field.
Create a chart
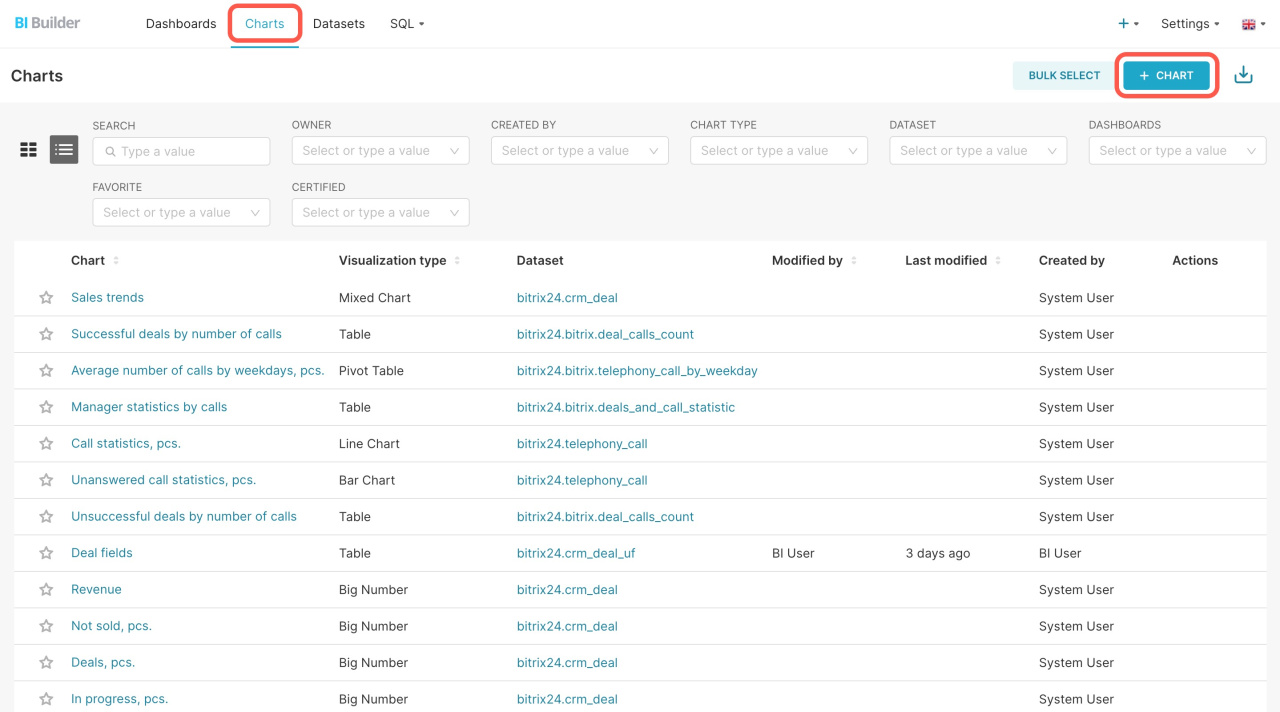
- Open the Charts section.
- Click + Chart.
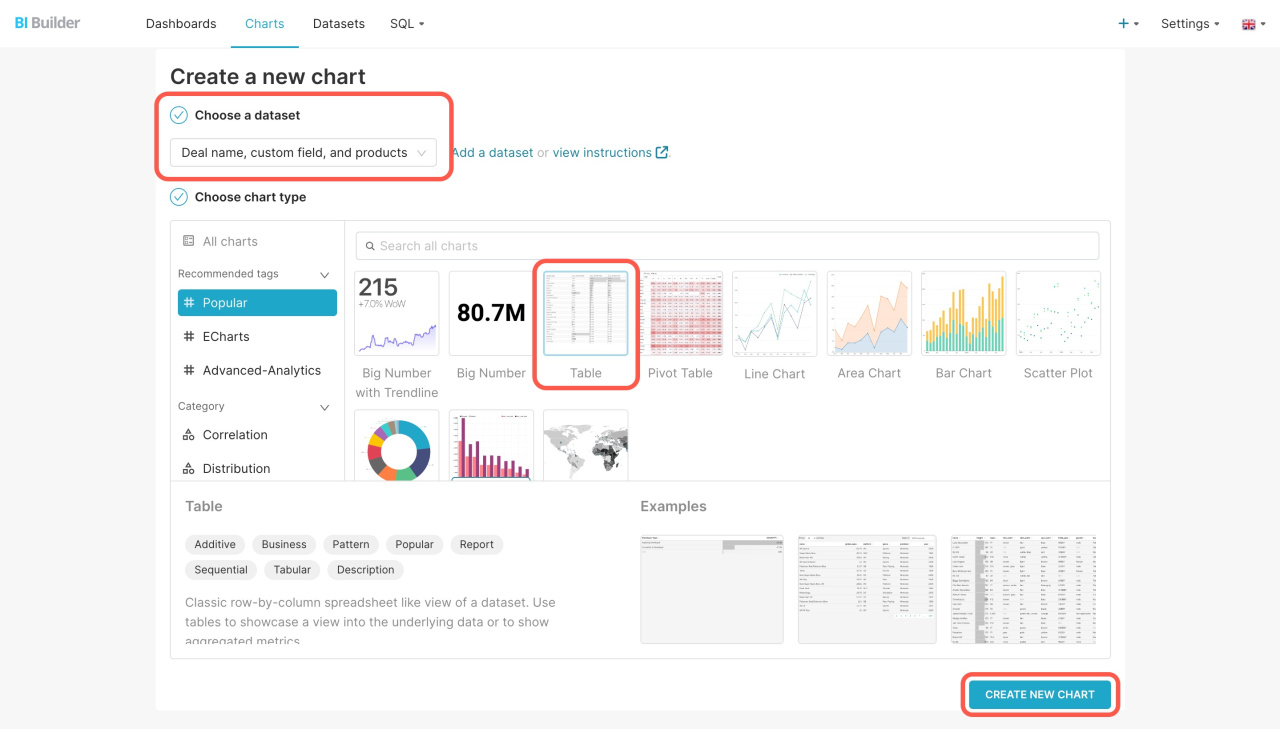
- Select your virtual dataset.
- Choose how to display the data.
- Click Create new chart.
Configure the chart
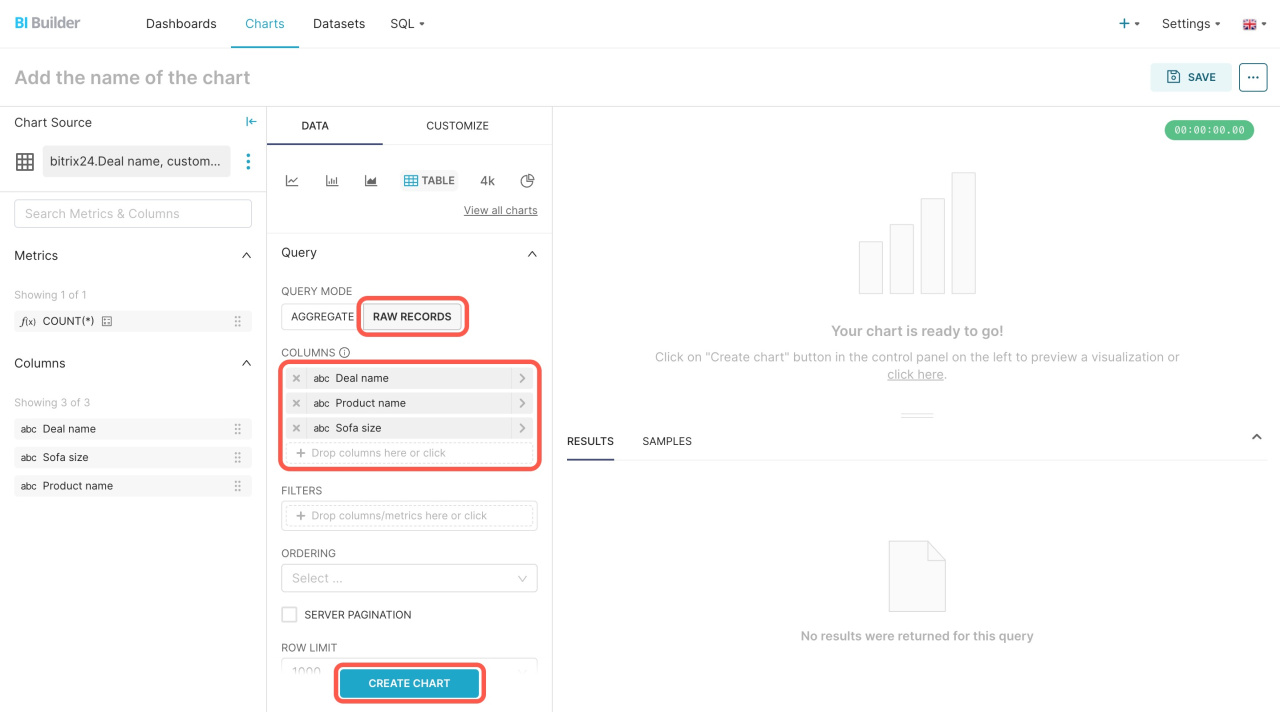
- Select Raw Records as the query mode.
- Move metrics to the Columns panel.
- Click Create chart.
Save the chart
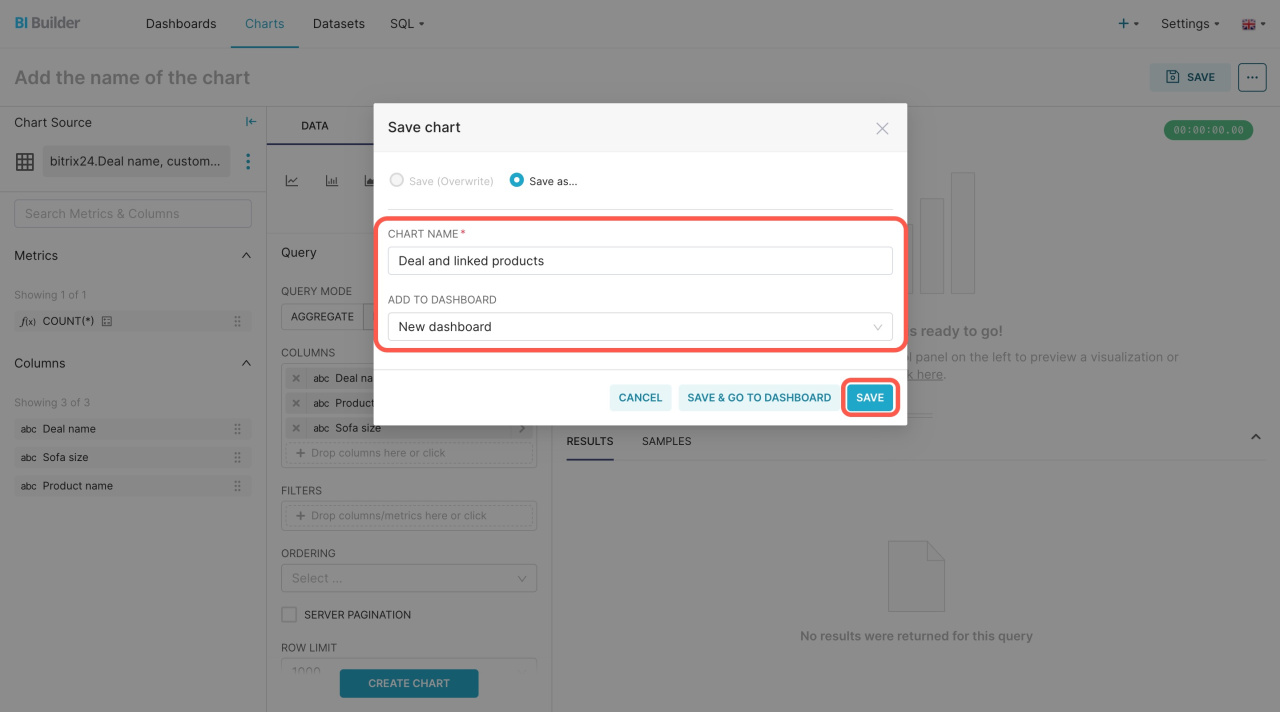
- Enter a name for the chart.
- Select a dashboard.
- Click Save.
View the result
- Return to Bitrix24.
- Reopen the report to see the updated dashboard.

In brief
- Use BI Builder to combine data into a virtual dataset with SQL.
- Select fields like deal name, products, and custom values.
- Rename columns to make charts easier to understand.