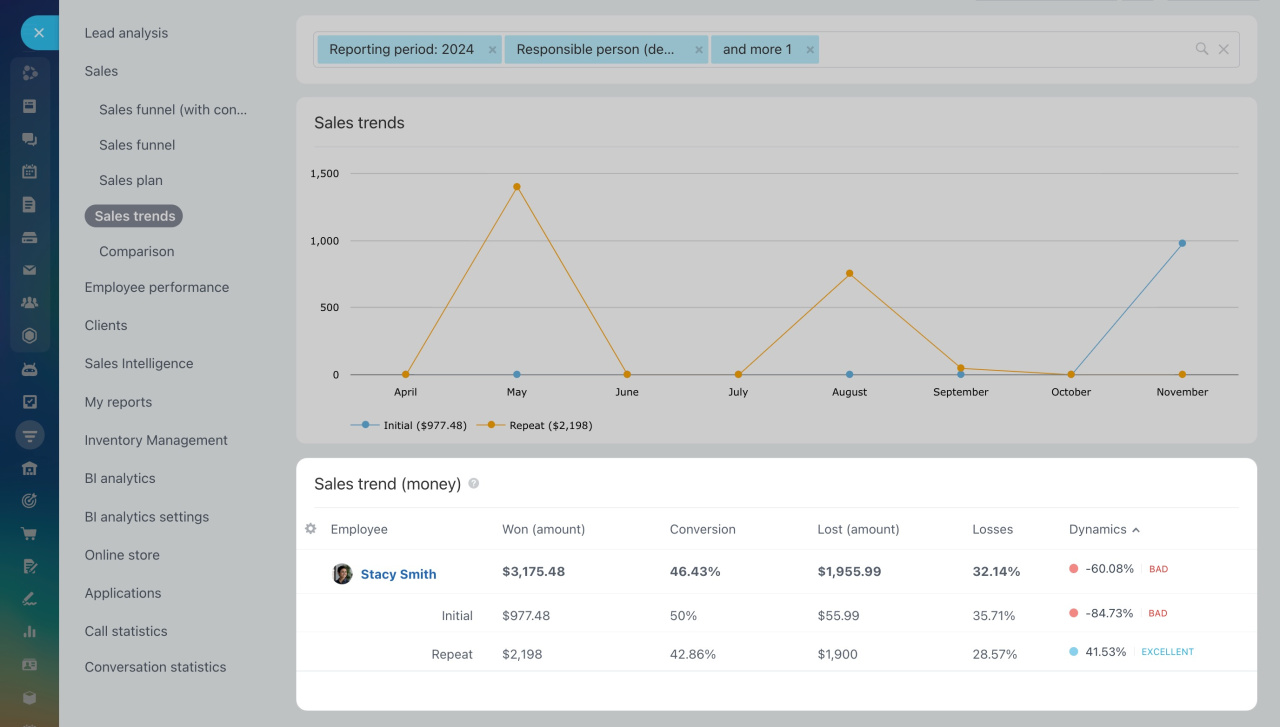


The Sales trends report shows the percentage of deals won and lost during a selected period. It also tracks changes in sales volume over time.
Cloud pricing
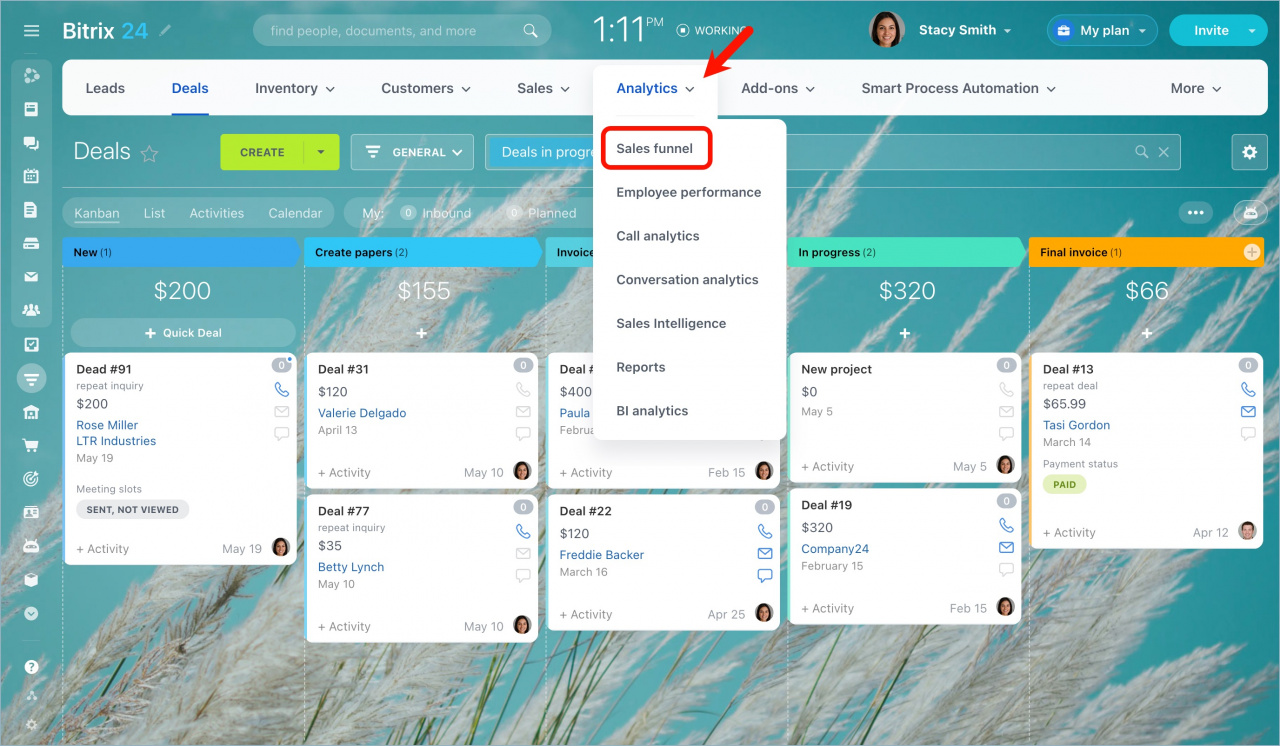
To open the Sales trends report:
- Go to CRM > Analytics > Real time analytics > Sales funnel.
- Select Sales trends on the left.
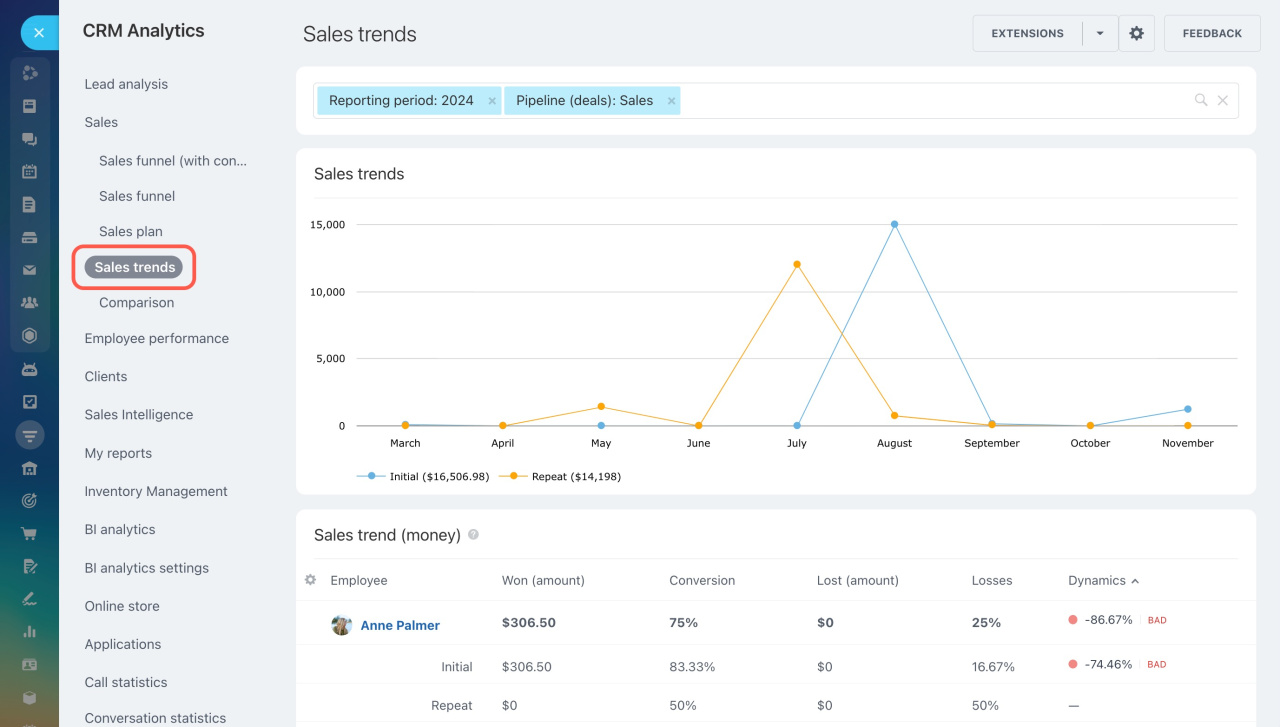
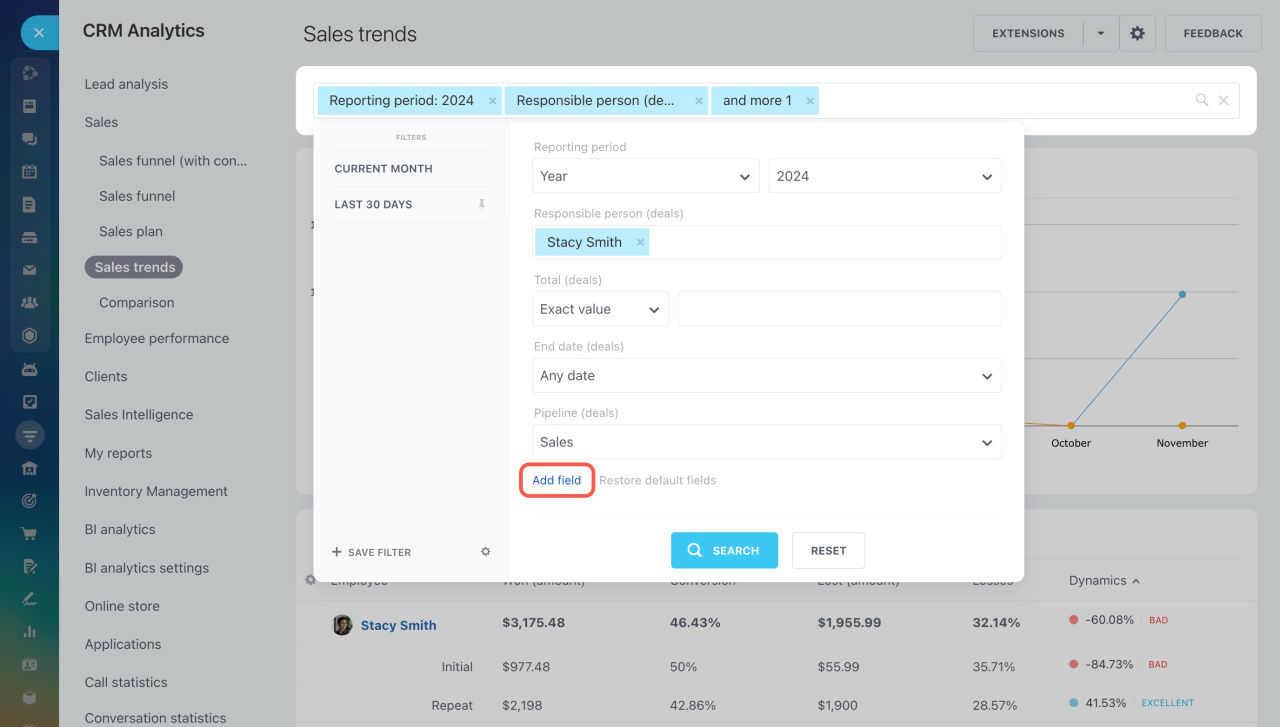
Use filters to narrow down the data. Select fields and set values. To add more filters, click Add field.
The report counts both new and repeat deals for each employee. It includes the following columns:
Won (amount): Total value of deals won during the selected period.
Conversion: Percentage of deals won during the selected period.
Lost (amount): Total value of deals lost during the selected period.
Losses: Percentage of deals lost during the selected period.
Dynamics: Change in the value of won deals compared to the previous period.
We evaluate sales performance using these ranges:
- Bad: dynamics ≤ 0%
- Average: 0% to 10%
- Good: 10% to 30%
- Excellent: over 30%